This is a description of simple usage scenario with Tarantula:
New software release has become available for testing, and user is excepted to quickly validate new release (“smoke testing”).
1. Log in to Tarantula
- User opens web browser to Tarantula web page and logs in.
- If you are trying out the demo, please login with username:user, password:user
2. Add Cases for New Features
Tarantula opens to dashboard view displaying interesting statistics about current project.
However, as we are in a hurry we do not have time to explore them right now. Instead we open case design mode to create new cases for new features.
- Move mouse over Design section on top bar
- Select Cases view from submenu
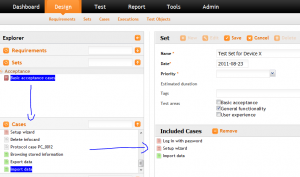
Design mode opens. On the left you see Navigator. Navigator is opened directly to Cases view, as selected from submenu. There are also views for Requirements, Sets, Executions and Test Objects.
For now we will focus on Cases view.
On the right side, you can see action buttons for manipulating cases.
Press New button to create new case.
There are lot of fields which could be filled. Fortunately only few are mandatory:
Title: This is the most important field (and some would say its the only important field). We are creating test cases for new features, and we do not know yet how they are implemented. So for now, we give just some general info what needs to be tested. These will be refined later when have more knowledge. So the title could be for example. “Forgotten password link sends new password to given email address”.
Date: Date will appear when test case was created. This is automatically filled, so no need to touch it now.
Priority: Test case priority. This affects display order in navigator views. High is for high priority, Normal is normal priority and Low is used for low priority.
We could also enter lot’s of additional information, define exact steps to run test case and even link case to requirements. But we are agile (lazy?) and will skip these.
Press Save. New case appears on the navigator on the left. You can view cases by clicking on them.
3. Define Test Object
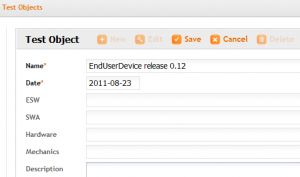
Next we define Test Object. It identifies actual “software/version/release” we are testing.
- Select Design – Test Objects from top menu
- Click New
- Enter identifying name. E.g. Supox Client 4.23.
- Save
- Once again newly created object appears on navigator.
4. Create Test Execution and Add Cases
Now we create (Test) Execution. Execution is a collection of test cases run for selected test object. So for each test object there may be several different executions. E.g. Smoke Test, Integration Test, Performace Tests etc.
- Select Design – Executions from top menu
- Click New
- Enter identifying name. E.g. Smoke Test.
- Select previously created Test Object
Now we need to add some cases for our test execution.
We could drag and drop individual cases to test execution, but we still feel lazy. Instead we use Tarantulas tagging features:
- Make sure that Cases navigator is open on the left. If not, click on title to expand it.
- On the top of the cases list there are tags which are basically collection of cases
- Move mouse over tag named “NeverTested” and hold down left mouse button,.
- Drag and drop tag to Cases section on Execution screen (bottom part).
- Dialog opens which asks to whom you will assign test cases. Assigning is not mandatory so you can just press Ok here without selecting anybody.
- Dropping Tag includes all cases, which have never been run before, to execution (and therefore includes cases which we have just created).
5. Test
Now it’s time for the real action, actual testing.
Select Test from toolbar. Testing view opens.
On the left there is once again explorer. On the top there is combobox for selecting execution to run.
Select execution.
Explorer will load all cases assigned to test execution. You can click on cases to select particular case.
When you click one of the cases, right side of display is updated to display that case:
- General Case information (Objective, Test Data etc.)
- Steps, including actions entering defect and comment.
- Toolbar for entering step result
- Pass
- Fail
- Skip
- Not Implemented
6. Reporting and Dashboard
After entering some case results, you can check status of your project.
Dashboard (Available from top menu) offers quick status view to your report. It is based on Test Object, meaning that you can select particular “release/version” to be viewed. There are various metrics displayed, e.g. how testing is progressing, failed cases, testing and requirement coverage etc.
There also various Reports available from toolbar.
Project Status is often useful for periodic reporting to top managers. Just select some test objects and click Generate to create report. There are some blank spots, where you can add additional free text reporting information (conclusions, next steps etc.). Once you have generated “reasonable explanations”, press Export Pdf. Share report to your boss with email, or deliver printed report to his desk (depending on his seniority level…)
Case Execution List is also often used report. It gives detailed information about executed cases. Use Export Spreadsheet to export data to excel or openoffice for fine tuning report.
This concludes our short tour with Tarantula. Hopefully you are now able to perform basic testing with Tarantula. Please explore this site for more tips how to utilize Tarantula!


